
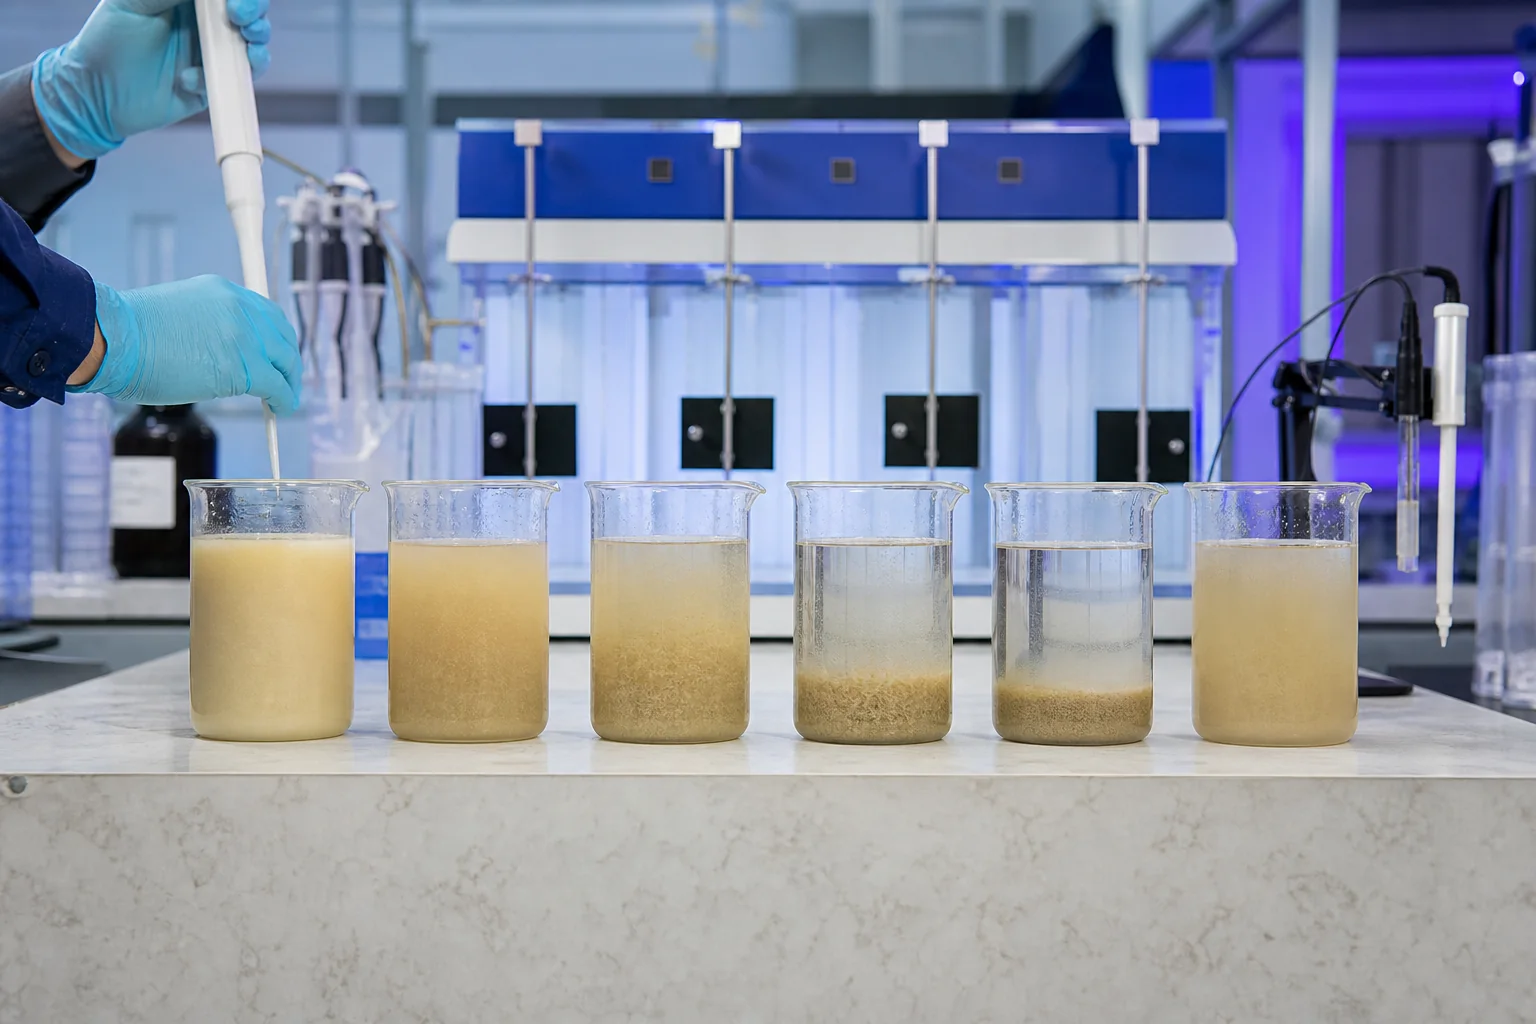
Weak floc is a symptom, not a diagnosis. The cause may be missing solids formation, unsuitable polymer character, incomplete dissolution, poor distribution, low active dose, overdose or shear after floc growth.
Verify the feed first
Check that the sample contains the same fine fraction, pH, salts and process reagents as the plant feed. Settled or aged samples can lose the particles that drive polymer demand. Recheck precipitation when the process removes dissolved metals or adjusts pH.
Inspect the stock solution
Look for dry clumps, fisheyes, screen residue, uneven viscosity and short maturation. Confirm powder and water delivery independently. Prepare a fresh laboratory stock with controlled water and compare it with the plant solution on the same feed.
Confirm dose and distribution
Convert pump output to active mass and verify the injection point. A viscous concentrated stream can pass through the slurry without contacting enough particles. Secondary dilution and multiple injection points may improve distribution, but excessive water can disturb a sensitive separator.
Check mixing and shear
Polymer needs initial distribution followed by gentle contact. Too little mixing leaves untreated zones; too much mixing shortens chains or breaks floc. Observe where floc forms and where it disappears through pumps, valves and feedwells.
Test the charge hypothesis
Compare a near-neutral candidate with an adjacent anionic or cationic product under identical conditions. No-response evidence may indicate that ionic interaction is needed. Do not keep increasing a nonionic dose when the curve remains flat.
Recognize overdose
High dose may produce light stringy floc, cloudy carryover, poor compaction, sticky sediment or slower filtration. Test downward as well as upward and allow enough time for the circuit to respond before interpreting a change.
Use a structured plant check
Hold feed and equipment as stable as possible. Change one variable, record the residence delay, then measure the controlling endpoint. Link the findings to the product profile selector before requesting a different sample.
Set acceptance limits before testing
For a weak-floc investigation, write the acceptance condition before polymer is added. Define the feed range, sampling point, baseline treatment and operating time represented by each sample. A trial cannot be compared fairly if the feed or primary chemistry changes while candidates are being ranked.
Use a numerical or clearly observable endpoint: formation time, floc size after defined shear, supernatant, sediment and downstream filtration. Record the method, sample timing and instrument condition. Include an operating constraint such as residence, pump capacity, filter cycle or downstream recovery so a visually attractive result does not hide a plant penalty.
Bracket normal feed variation
Build at least two feed cases around fresh and aged feed, normal and upset chemistry, and laboratory versus plant stock solution. Test the same candidate set and active-dose steps on both. A narrow optimum on one easy sample is less useful than a broader response that remains controllable through the expected production envelope.
Keep preparation water, stock concentration, maturation, solution age and mixing sequence identical. When one variable must change, run a bridge comparison so the chemistry effect can be separated from the preparation effect.
Read the full response curve
Plot the blank, current product and candidate results against active dose. Mark the first useful response, the stable operating region and the point where more addition gives no benefit or reverses performance. Repeat the middle and high points before deciding that overdose has been located.
When dose increases produce no slope, temporary floc breaks immediately or high-dose haze appears, stop changing several variables together. Check sample integrity, precipitation or coagulation, polymer stock, dose calculation, distribution and shear in that order. Only then compare a different molecular or ionic profile.
Carry the result into the plant
For scale-up, use a short diagnostic trial that changes only preparation, dose, mixing or charge family in separate steps. Allow the full hydraulic or recycle residence after each change. Collect feed and product samples at matched times, keep equipment settings stable and record operator observations alongside laboratory measurements.
Convert pump settings and solution flow back to active polymer consumption. Reconcile the calculated value with inventory over a stable period. Differences often expose feeder calibration, tank turnover, dilution or recirculation errors that were invisible in the jar test.
Close the technical and purchasing record
Retain the product code, lot, preparation sheet, dose curve, photographs, instrument readings and plant result. State the approved feed range and the condition that requires retesting. This keeps a successful sample connected to the material later ordered and received.
Request COA, TDS and SDS for the exact grade. Compare packaging, freight, storage, make-down demand, active consumption and separation value as delivered treatment cost. Do not replace application evidence with a single molecular-weight, viscosity or hydrolysis number.