
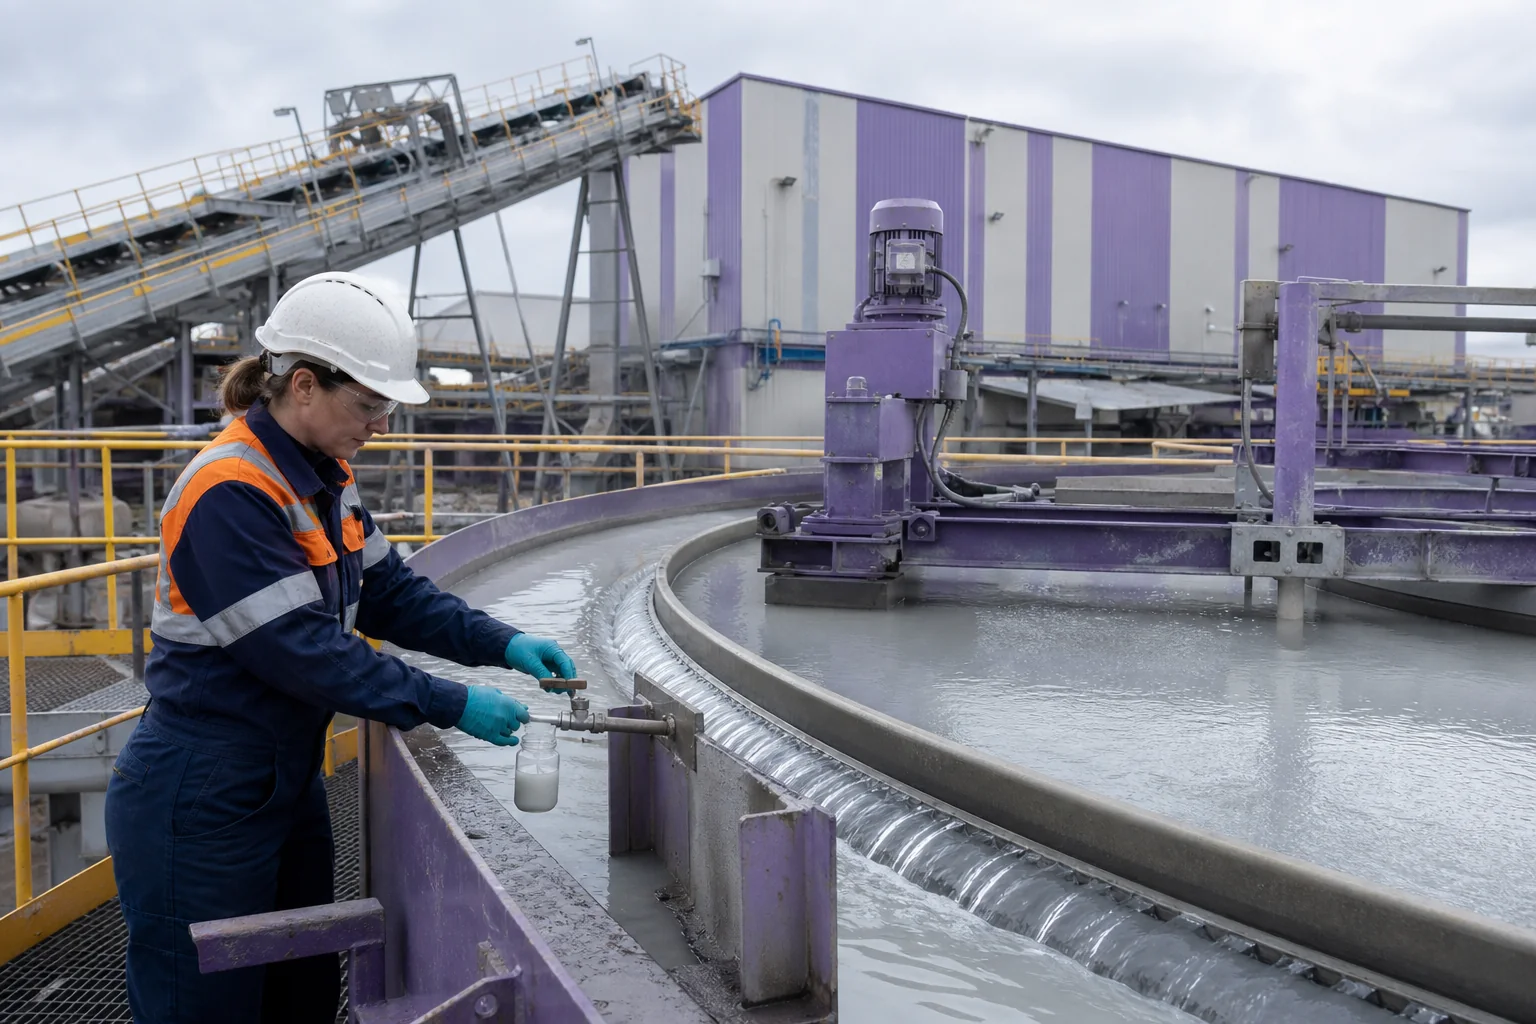
Return-water trials must evaluate two linked outcomes: removal of fine solids and the effect of recycled water on the beneficiation circuit. A clear overflow is incomplete evidence when reagents or adsorbed polymer return upstream.
Map the circuit
Document grinding, classification, flotation or magnetic separation, thickening, filtration, water storage and recycle points. Mark every coagulant, flocculant, collector, frother, dispersant, acid and lime addition. Identify the delay between a chemical change and a downstream sample.
Characterize representative water
Record ore campaign, mineralogy where known, particle-size distribution, clay or quartz fines, solids, pH, conductivity, hardness and dissolved metals. Compare established return water with fresh make-up water when recycle accumulation is suspected.
Screen separation performance
Prepare nonionic candidates consistently and dose on active mass per dry solids. Measure initial floc formation, interface velocity, supernatant turbidity, sediment volume, compaction and response after defined shear. Include relevant anionic comparison where appropriate.
Protect beneficiation performance
Test flotation recovery, concentrate grade, tailings loss, filtration or washing when treated water returns to those stages. Avoid direct polymer dosing into flotation unless a targeted study supports it. Adsorbed polymer can change mineral surface behavior.
Run a controlled plant trial
Hold mechanical settings constant for the first comparison, allow the full circuit residence and sample the same locations. Record overflow, underflow, product consumption and downstream indicators before adjusting injection or equipment.
Approve a circuit-specific window
Keep the product code, lot, preparation, dose band, water range and beneficiation results together. Send normal and high-fines conditions through the trial worksheet.
Set acceptance limits before testing
For a mineral return-water trial, write the acceptance condition before polymer is added. Define the feed range, sampling point, baseline treatment and operating time represented by each sample. A trial cannot be compared fairly if the feed or primary chemistry changes while candidates are being ranked.
Use a numerical or clearly observable endpoint: overflow solids, settling flux, underflow handling, water recovery and flotation or separation response. Record the method, sample timing and instrument condition. Include an operating constraint such as residence, pump capacity, filter cycle or downstream recovery so a visually attractive result does not hide a plant penalty.
Bracket normal feed variation
Build at least two feed cases around ore campaign, ultrafine fraction, recycle conductivity, hardness and residual beneficiation reagents. Test the same candidate set and active-dose steps on both. A narrow optimum on one easy sample is less useful than a broader response that remains controllable through the expected production envelope.
Keep preparation water, stock concentration, maturation, solution age and mixing sequence identical. When one variable must change, run a bridge comparison so the chemistry effect can be separated from the preparation effect.
Read the full response curve
Plot the blank, current product and candidate results against active dose. Mark the first useful response, the stable operating region and the point where more addition gives no benefit or reverses performance. Repeat the middle and high points before deciding that overdose has been located.
When clarifier performance improves while concentrate recovery, grade, filtration or wash performance moves adversely, stop changing several variables together. Check sample integrity, precipitation or coagulation, polymer stock, dose calculation, distribution and shear in that order. Only then compare a different molecular or ionic profile.
Carry the result into the plant
For scale-up, run the finalist through a full recycle residence and sample both the water circuit and downstream beneficiation. Allow the full hydraulic or recycle residence after each change. Collect feed and product samples at matched times, keep equipment settings stable and record operator observations alongside laboratory measurements.
Convert pump settings and solution flow back to active polymer consumption. Reconcile the calculated value with inventory over a stable period. Differences often expose feeder calibration, tank turnover, dilution or recirculation errors that were invisible in the jar test.
Close the technical and purchasing record
Retain the product code, lot, preparation sheet, dose curve, photographs, instrument readings and plant result. State the approved feed range and the condition that requires retesting. This keeps a successful sample connected to the material later ordered and received.
Request COA, TDS and SDS for the exact grade. Compare packaging, freight, storage, make-down demand, active consumption and separation value as delivered treatment cost. Do not replace application evidence with a single molecular-weight, viscosity or hydrolysis number.