
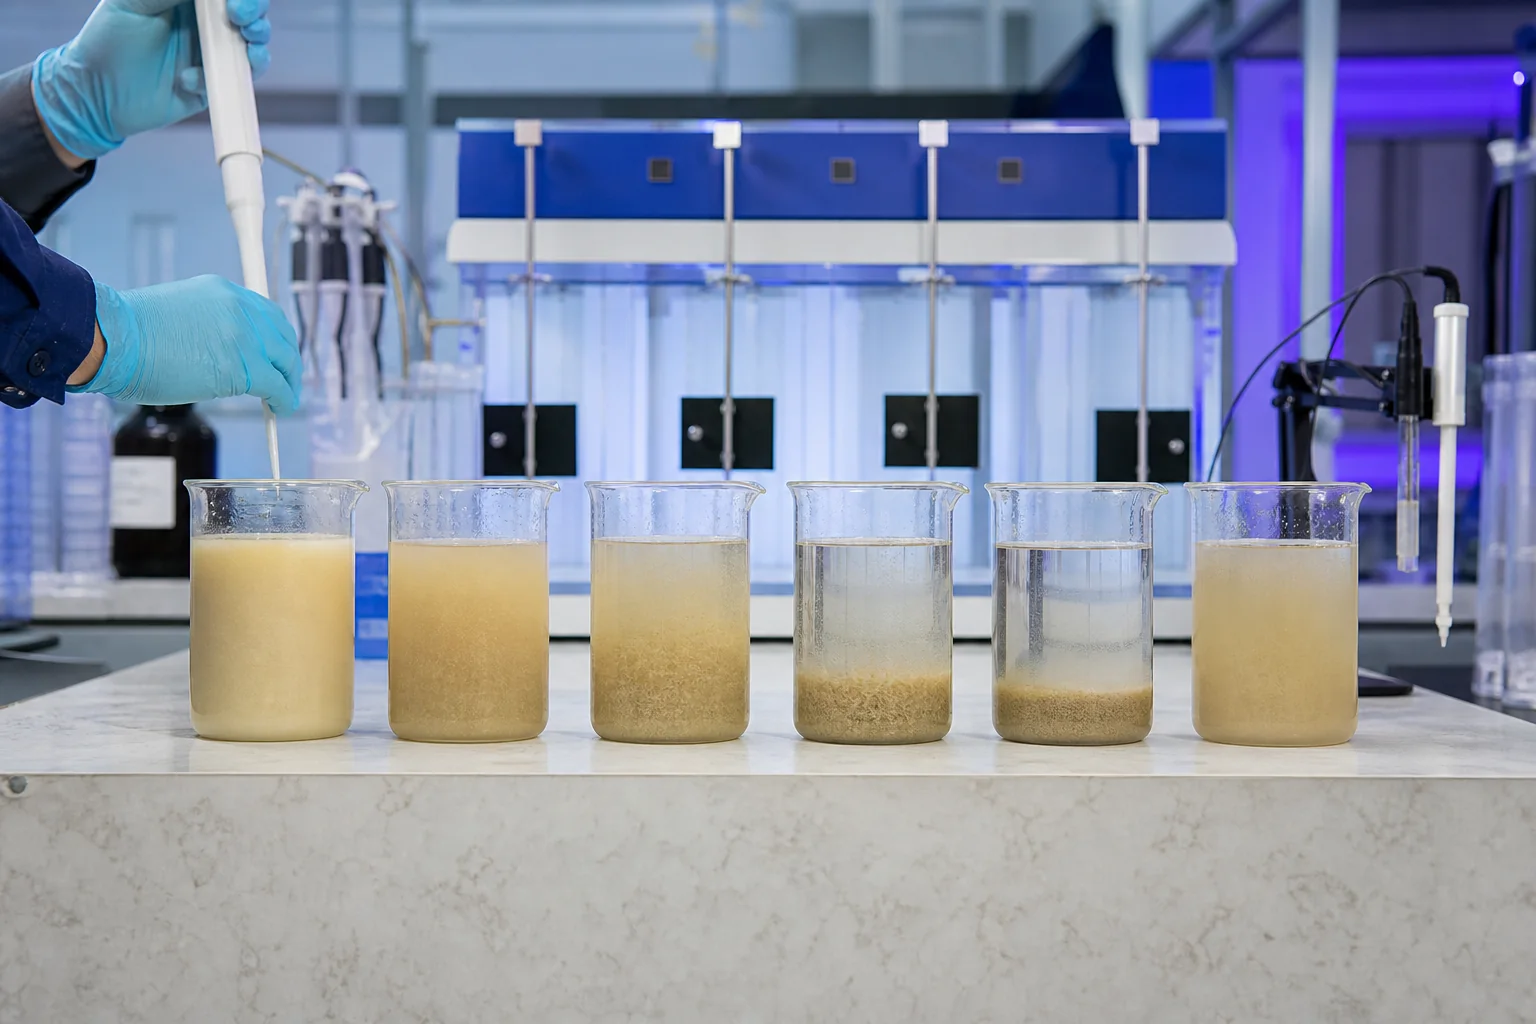
Nonionic and anionic PAM can both bridge fine solids, but their ionic character changes how water chemistry and particle surfaces influence adsorption. The correct comparison uses the same feed, active dose and preparation—not a generic industry chart.
Start with the real distinction
Nonionic PAM carries little ionic character and relies mainly on adsorption and bridging. Anionic PAM includes negatively charged groups whose conformation and interaction can respond strongly to multivalent ions and particle charge. Molecular architecture varies inside both families.
A product name does not identify molecular weight, chain distribution, dissolution behavior or the supplier method used to describe charge.
Use pH as one input
Acidic conditions can justify including a nonionic candidate, but pH alone does not assign the winner. Conductivity, calcium, magnesium, dissolved metals, coagulants, mineralogy and organics also affect adsorption and floc growth.
Measure chemistry at the polymer addition point rather than relying only on raw-feed data when neutralization or coagulation occurs upstream.
Build a fair comparison matrix
Choose adjacent candidates, prepare them with identical water and maturation, and compare equal active mass over the same dose range. Hold primary coagulant and mixing fixed. Include a blank and current-product baseline.
Record settling, supernatant, sediment, filtration and shear response. Avoid choosing from floc size alone because very large floc may compact poorly or break in transfer.
Consider the downstream circuit
In mineral and coal processing, adsorbed polymer can change flotation or selective separation. Test recycled water and confirm recovery or product quality when polymer-treated water returns. In industrial clarification, verify sludge dewatering rather than shifting cost from the clarifier.
Interpret weak results
If both products fail, recheck preparation, solids representativeness, precipitation and mixing. If only high doses respond, calculate the true active dose and evaluate a different charge or coagulant sequence. If clarity improves then reverses, locate the overdose boundary.
Translate the result into purchasing
Specify the tested grade code, lot, solution method, dose band, feed range and acceptance endpoint. Keep the comparison sheet with the COA and retained sample. Use the nonionic PAM product profiles to define the next sample set.
Set acceptance limits before testing
For a nonionic-versus-anionic comparison, write the acceptance condition before polymer is added. Define the feed range, sampling point, baseline treatment and operating time represented by each sample. A trial cannot be compared fairly if the feed or primary chemistry changes while candidates are being ranked.
Use a numerical or clearly observable endpoint: settling rate, supernatant quality, compaction, shear recovery and downstream process compatibility. Record the method, sample timing and instrument condition. Include an operating constraint such as residence, pump capacity, filter cycle or downstream recovery so a visually attractive result does not hide a plant penalty.
Bracket normal feed variation
Build at least two feed cases around pH, hardness, conductivity, mineral fines and multivalent-ion concentration. Test the same candidate set and active-dose steps on both. A narrow optimum on one easy sample is less useful than a broader response that remains controllable through the expected production envelope.
Keep preparation water, stock concentration, maturation, solution age and mixing sequence identical. When one variable must change, run a bridge comparison so the chemistry effect can be separated from the preparation effect.
Read the full response curve
Plot the blank, current product and candidate results against active dose. Mark the first useful response, the stable operating region and the point where more addition gives no benefit or reverses performance. Repeat the middle and high points before deciding that overdose has been located.
When one family forms larger floc but produces worse overflow, compaction or downstream recovery, stop changing several variables together. Check sample integrity, precipitation or coagulation, polymer stock, dose calculation, distribution and shear in that order. Only then compare a different molecular or ionic profile.
Carry the result into the plant
For scale-up, trial the two finalists in separate stable periods and keep injection, dilution and separator settings unchanged. Allow the full hydraulic or recycle residence after each change. Collect feed and product samples at matched times, keep equipment settings stable and record operator observations alongside laboratory measurements.
Convert pump settings and solution flow back to active polymer consumption. Reconcile the calculated value with inventory over a stable period. Differences often expose feeder calibration, tank turnover, dilution or recirculation errors that were invisible in the jar test.
Close the technical and purchasing record
Retain the product code, lot, preparation sheet, dose curve, photographs, instrument readings and plant result. State the approved feed range and the condition that requires retesting. This keeps a successful sample connected to the material later ordered and received.
Request COA, TDS and SDS for the exact grade. Compare packaging, freight, storage, make-down demand, active consumption and separation value as delivered treatment cost. Do not replace application evidence with a single molecular-weight, viscosity or hydrolysis number.