
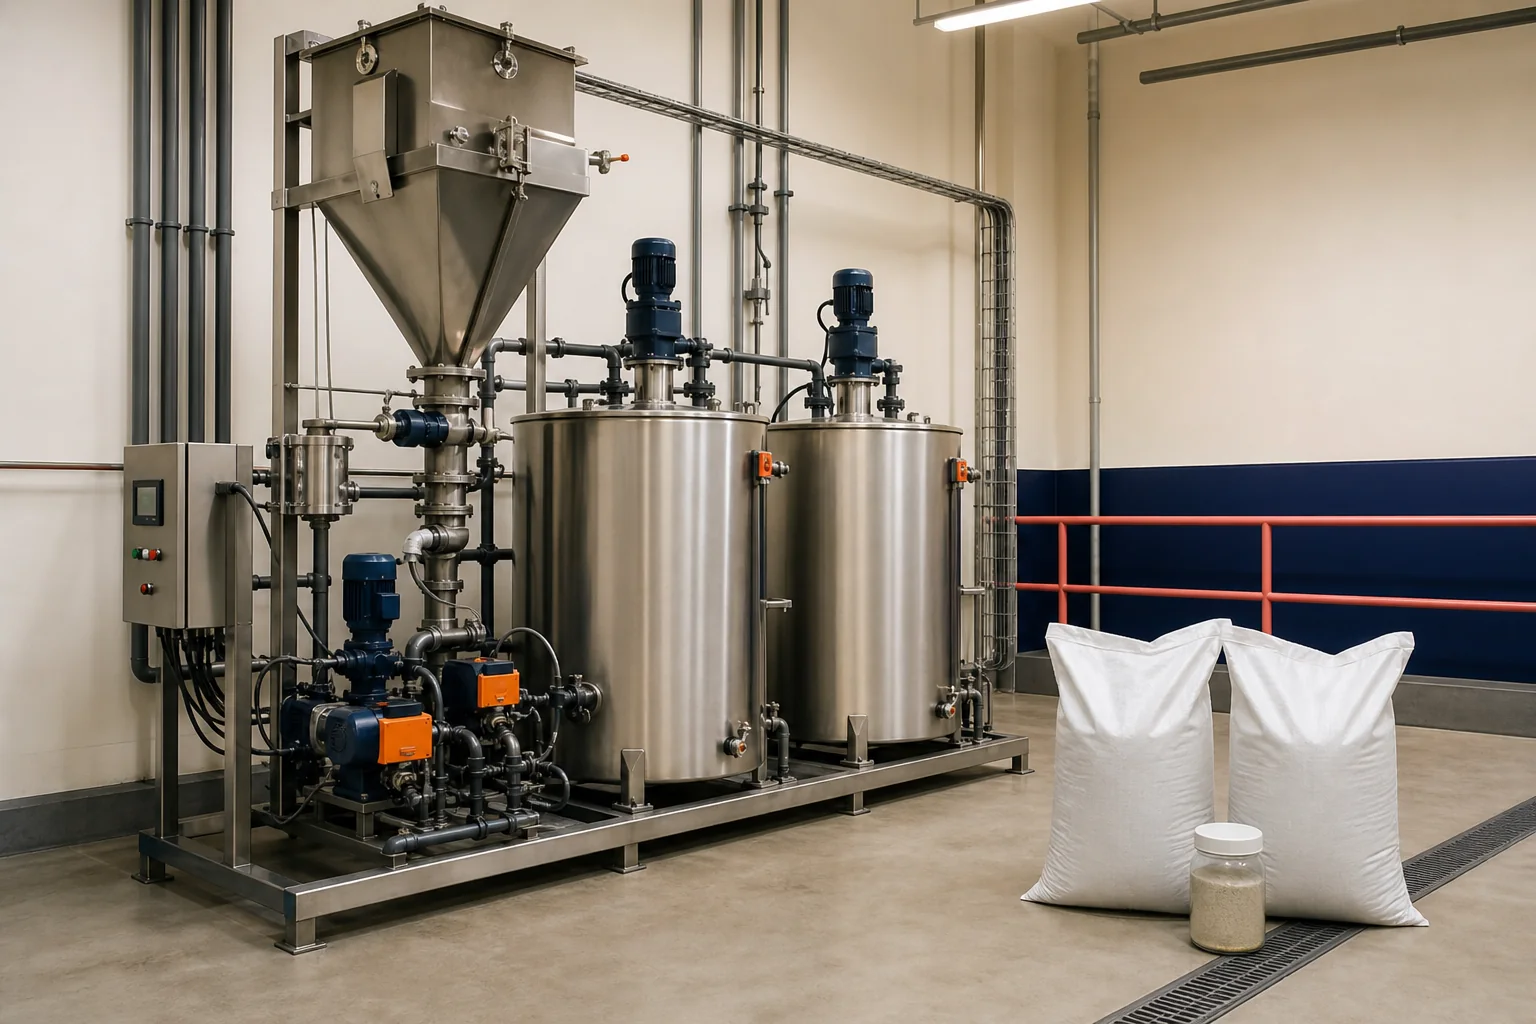
Dose comparisons become unreliable when one result is reported as solution flow, another as product per water volume and another as active polymer per dry solids. Convert every trial to a common active basis before ranking products.
Define the reporting basis
Clarification of dilute water is often tracked as active milligrams per litre. Slurry, tailings and filter duties are better compared as active grams or kilograms per dry tonne. Record both when flow and solids vary.
State whether commercial product is treated as supplied or corrected for solids or active content. Use the same convention across candidates.
Calculate active polymer flow
Multiply stock-solution mass flow by its active mass fraction. For a dilute solution, confirm density or use a justified approximation and document it. A nominal 0.1 percent recipe is not reliable until powder feeder and water flow have been measured.
Secondary dilution changes delivery volume but not active polymer mass.
Calculate dry-solids flow
Multiply slurry volumetric flow by slurry density and dry-solids mass fraction, using compatible units. If only suspended solids in milligrams per litre are available, convert that concentration with the water flow and recognize that it may not represent a concentrated sludge.
Form the dose ratio
Divide active polymer mass flow by dry-solids mass flow and convert to grams per tonne or kilograms per dry tonne. Keep sufficient significant figures during calculation, then round the operating setpoint to the accuracy the feeder can control.
Cross-check the result against inventory consumption over a stable production period.
Calibrate real equipment
Collect timed dry-feeder output at several speeds, measure make-down water and verify solution-pump delivery against discharge pressure. Inspect tank turnover and line recirculation. Correcting a calculation without calibrating hardware leaves the plant dose unknown.
Build a dose curve
Test points below and above the current value while feed and equipment remain stable. Plot the required endpoint with active dose and include sludge, filtration, water recovery and downstream process effects.
Supply the numbers with the RFQ
Provide each input, unit, sampling time and calculation. Include the process target and monthly consumption so Xinqi Polymer can compare product candidates and commercial supply on the same basis.
Set acceptance limits before testing
For an active-dose calculation, write the acceptance condition before polymer is added. Define the feed range, sampling point, baseline treatment and operating time represented by each sample. A trial cannot be compared fairly if the feed or primary chemistry changes while candidates are being ranked.
Use a numerical or clearly observable endpoint: active milligrams per litre or kilograms per dry tonne tied to the measured separation result. Record the method, sample timing and instrument condition. Include an operating constraint such as residence, pump capacity, filter cycle or downstream recovery so a visually attractive result does not hide a plant penalty.
Bracket normal feed variation
Build at least two feed cases around minimum and maximum process flow, slurry density, solids fraction and stock concentration. Test the same candidate set and active-dose steps on both. A narrow optimum on one easy sample is less useful than a broader response that remains controllable through the expected production envelope.
Keep preparation water, stock concentration, maturation, solution age and mixing sequence identical. When one variable must change, run a bridge comparison so the chemistry effect can be separated from the preparation effect.
Read the full response curve
Plot the blank, current product and candidate results against active dose. Mark the first useful response, the stable operating region and the point where more addition gives no benefit or reverses performance. Repeat the middle and high points before deciding that overdose has been located.
When calculated consumption differs from bag inventory, pump calibration or solution-tank depletion, stop changing several variables together. Check sample integrity, precipitation or coagulation, polymer stock, dose calculation, distribution and shear in that order. Only then compare a different molecular or ionic profile.
Carry the result into the plant
For scale-up, measure feeder and pump delivery under operating pressure, then reconcile a timed mass balance across one stable shift. Allow the full hydraulic or recycle residence after each change. Collect feed and product samples at matched times, keep equipment settings stable and record operator observations alongside laboratory measurements.
Convert pump settings and solution flow back to active polymer consumption. Reconcile the calculated value with inventory over a stable period. Differences often expose feeder calibration, tank turnover, dilution or recirculation errors that were invisible in the jar test.
Close the technical and purchasing record
Retain the product code, lot, preparation sheet, dose curve, photographs, instrument readings and plant result. State the approved feed range and the condition that requires retesting. This keeps a successful sample connected to the material later ordered and received.
Request COA, TDS and SDS for the exact grade. Compare packaging, freight, storage, make-down demand, active consumption and separation value as delivered treatment cost. Do not replace application evidence with a single molecular-weight, viscosity or hydrolysis number.